Crime statistics for reporters: FBI Crime Data Explorer, NIBRS and the NCVS
How to use the FBI Crime Data Explorer, NIBRS and Bureau of Justice Statistics surveys, and how to compare agencies and years without misleading readers. Each link was checked in October 2026.
On this page
- What do federal crime statistics measure?
- Start here
- Can you rank cities by crime?
- How do you compare agencies and years responsibly?
- How does the FBI Crime Data Explorer work?
- What is the difference between UCR, SRS and NIBRS?
- What does the National Crime Victimization Survey measure?
- Why do FBI and BJS numbers differ?
- How current is crime data, and where do faster numbers come from?
- Where do you get the raw data?
- Where can you cross-check a number?
- How do you write the number?
- Sources
What do federal crime statistics measure?
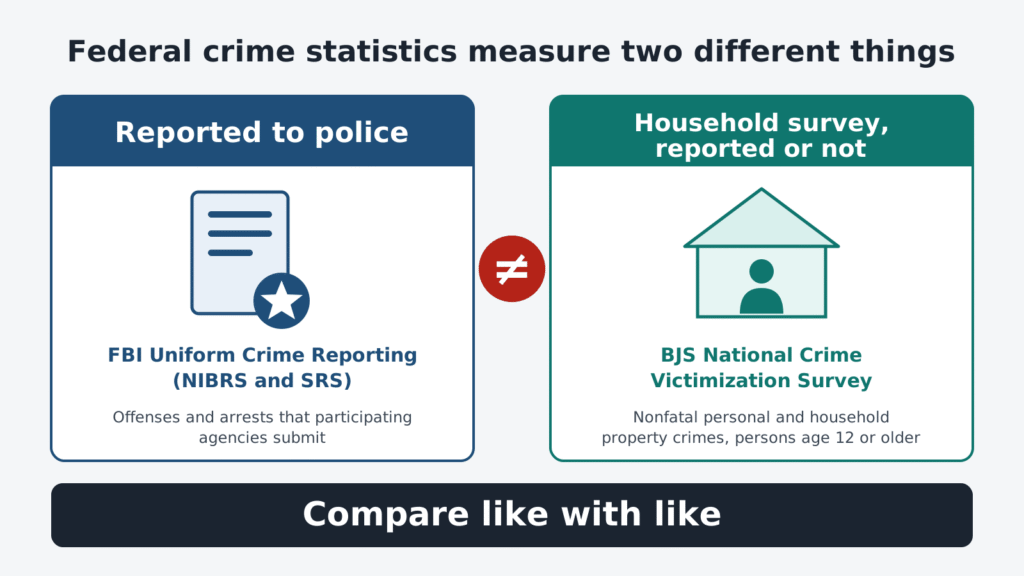
They measure two different things. The FBI counts crime that agencies report to it. The Bureau of Justice Statistics (BJS) asks households about crime, whether or not anyone called the police.
The FBI’s Uniform Crime Reporting (UCR) Program, in its words, “provides a nationwide view of crime based on data submissions from law enforcement agencies throughout the country.” BJS calls its National Crime Victimization Survey (NCVS) “the nation’s primary source of information on criminal victimization.”
| Question | Source | What it counts | Main limit |
|---|---|---|---|
| What did agencies report to the FBI? | FBI Crime Data Explorer (UCR: NIBRS and SRS) | Offenses and arrests that participating agencies submit | The FBI’s footnote says not all agencies provide data for complete reporting periods |
| How much crime did people experience, reported or not? | BJS NCVS | Nonfatal personal and household property crimes, “both reported and not reported to the police” | A sample survey of persons age 12 or older. Estimates that appear different “may not be statistically different” |
| What are the national estimates from NIBRS data? | BJS Crime Known to Law Enforcement, 2024 | NIBRS-based national estimates | The BJS bulletin says NIBRS estimates “use imputation and weighting procedures to account for nonresponse and missing data” |
This guide covers national and agency-level statistics. For charging documents, dockets and other case records, start with the Crime, Courts and Law guide. For incident reports, use the FOIA guide.
Start here
FBI Crime Data Explorer
The FBI’s portal for UCR data. Its home page says to use it “to discover data through visualizations, downloads in .csv format, and other large data files.”
CDE Documents and Downloads
CSV downloads, annual and year-to-date master files, NIBRS estimation data and the Crime Data API. The page warns that the data are dynamic, so note the time stamp.
UCR Statistics: Their Proper Use
The FBI’s May 2017 statement on why it does not rank agencies and what to weigh instead.
BJS National Crime Victimization Survey
The federal household survey on victimization, with reports, questionnaires and data tools.
The Nation’s Two Crime Measures, 2015-2024
A BJS report that sets NCVS rates beside NIBRS estimates for the same ten years. Read it before you cite both in one story.
UCR Summary of Reported Crimes in the Nation, 2025
The FBI’s August 2026 summary of its latest national estimates, participation counts and a section on how its numbers differ from other measures.
Can you rank cities by crime?
No. The FBI does not publish agency rankings and “strongly discourages” them. A city’s count also reflects the factors the FBI lists below, not only how much crime occurs.
The CDE does publish violent and property crime tables by city, university or college, county, and state, tribal and other agencies. A sorted table can look like a ranking. The FBI’s Proper Use statement lists what it does not do:
- It “does not provide agency-based crime statistics to data users in a ranked format.”
- It “cautions and, in fact, strongly discourages, data users against using rankings to evaluate locales or the effectiveness of their law enforcement agencies.”
Myth: The cities at the top of a crime table are the most dangerous.
Why it persists: Agency tables put many cities in one list, and each row carries a count and a population.
Correction: The FBI’s statement lists factors that vary from place to place. They include population density and degree of urbanization, youth concentration, economic conditions, the effective strength of law enforcement agencies and the crime reporting practices of the citizenry. A 2012 FBI resource page adds that “one city may report more crime than a comparable one, not because there is more crime, but rather because its law enforcement agency, through proactive efforts, identifies more offenses.”
Takeaway: Report one agency’s counts and rates over time, with its participation noted. If you set two places side by side, name what differs between them and attribute the comparison to the data.
The FBI is not alone. BJS says of its state-level victimization estimates that “users are cautioned against ranking areas solely based on these data without considering the fuller context of local conditions and characteristics.”
How do you compare agencies and years responsibly?
Check six things before you set one number beside another. Each check comes from a caution the FBI or BJS publishes.
| Check | What to look at | Source |
|---|---|---|
| Participation | The CDE’s current-year agency tables hold only “agencies submitting 12 months of complete offense data.” An agency missing from a table may not have submitted a full year. | CDE home page |
| Counting rules | Summary (SRS) counts only the most serious offense in an incident. NIBRS counts up to 10. The IACP (Trade group), in its NCS-X NIBRS messaging document, says users “should not compare crime statistics using NIBRS data with crime statistics reported using the traditional counting rules.” | FBI summary, 2025, IACP |
| Break years | The FBI says its 2021 estimates “are not comparable to other yearly estimates.” In 2013 the rape definition changed. | FBI summary, 2025 |
| Revisions | For its annual publication tables, the CDE downloads page says the FBI “cautions readers against making comparisons between the data in this publication and those in prior editions.” The 2024 violent crime rate was updated in the 2025 report. | CDE downloads |
| Trend method | The FBI’s trend tables use agencies that reported 6 or more common months of data in both years. National estimates use a different method. | FBI summary, 2025 |
| Survey error | BJS says that for NCVS estimates, “estimates that appear different may not be statistically different.” Check the margin before you call a survey change real. | BJS NCVS |
Worked example (hypothetical)
Example City has 90 robberies and 60,000 residents. Example County has 300 robberies and 400,000 residents. The FBI expresses crime as a rate per 100,000 inhabitants. The city’s rate is 90 / 60,000 x 100,000 = 150.0. The county’s rate is 300 / 400,000 x 100,000 = 75.0. The county has the higher count and the lower rate. Neither place is a real jurisdiction. For population figures, see the Census and Demographics guide.
How does the FBI Crime Data Explorer work?
The Crime Data Explorer (CDE) is the FBI’s public site for UCR data. Pick the tool by the question you are asking.
| Task | Where on the CDE | What the FBI says |
|---|---|---|
| Read the latest national numbers | “UCR Summary of Reported Crimes in the Nation, 2025” | Based on submissions from 17,075 law enforcement agencies |
| Look up a city, college, county or tribal agency | “2025 Reported Violent and Property Crime” tables | Tables are by city, university or college, county, and state, tribal and other agencies |
| Build your own query | Data Discovery Tool | “Create data inquiries based on criteria selected for data year(s), level of data, and offense type(s).” |
| Compare agencies or states | “Compare Crime Data Between States/Agencies” quick search | Listed among the home page’s quick searches |
| Get NIBRS national estimates | NIBRS Estimation | “Provides national estimates of key elements of crime known to law enforcement based on NIBRS data.” |
| Download files | Documents and Downloads | CSV files, master files and the Crime Data API |
The CDE is a dynamic site, and it changes. Its downloads page says: “Because these data are dynamic, be aware of the time stamp that reflects the date of content.” Record the date you pulled each figure.
How do you find statistics for one city or agency?
- Open the CDE home page. Find the current-year reported crime tables for cities, colleges, counties or tribal agencies.
- Find your agency. The tables hold agencies that submitted 12 months of complete offense data. If yours is missing, ask the agency or its state UCR program why.
- Note the agency type and population. The tables list city, college, county and tribal agencies separately.
- Use the rate for size, the count for small places. See the checks above.
- Contact the state program. The FBI says to contact the state UCR program or the agency about reporting status. A state UCR program contact list is on the FBI’s site. It carries no date, so confirm the contact before you call.
- Ask for incident-level records. Use the FOIA guide for the agency’s own reports.
What is the difference between UCR, SRS and NIBRS?
UCR is the FBI program. SRS and NIBRS are the two ways agencies send it data. The FBI began collecting NIBRS in 1989, and NIBRS became the national standard on January 1, 2021, according to BJS.
| Feature | Summary Reporting System (SRS) | National Incident-Based Reporting System (NIBRS) |
|---|---|---|
| Offenses per incident | Only the most serious offense is counted | Up to 10 offenses in one incident |
| Detail | Aggregated counts | Incident date and time, weapons, property, injuries, and victim, offender and arrestee demographics |
| History | In use since 1930 | FBI began collecting in 1989 |
The FBI explains the SRS hierarchy rule this way: “if a criminal incident includes a robbery and a murder, the hierarchy rule dictates that a law enforcement agency reports only the murder.”
Who reports to the FBI, and is it mandatory?
The FBI’s 2024 FAQ says most non-federal agencies participate voluntarily. Participation in the 2025 report, from the FBI’s Table 1:
| Measure | 2024 | 2025 |
|---|---|---|
| NIBRS agencies | 14,601 (75.5% of enrolled agencies) | 15,099 (77.2%) |
| NIBRS population covered | 296,527,998 (87.2%) | 305,977,619 (89.5%) |
| SRS agencies | 2,074 (10.7%) | 1,976 (10.1%) |
| All participating agencies | 16,675 (86.3%) | 17,075 (87.3%) |
| All participating population | 325,100,512 (95.6%) | 328,918,006 (96.2%) |
The FBI accepted SRS data for 2022, 2023 and 2024. Its FAQ says that despite more than 11,500 agencies submitting NIBRS data for 2021, “participation remained below a statistically acceptable level to be nationally representative for trending analyses.” BJS’s NIBRS page gives a different coverage figure, 82% of the population as of May 2024. The two use different dates and bases, so cite each with its date.
Myth: NIBRS makes crime look higher.
Why it persists: NIBRS records more offenses and more detail per incident than SRS, and the FBI says some agencies feared that fuller reporting “may make it appear crime rates have risen.”
Correction: The FBI’s FAQ calls that fear a misconception. A BJS study of 1,131 agencies, covering 1991 to 1996, found murder rates were the same under both systems. Rape, robbery and aggravated assault were about 1% higher on average, and burglary was 0.5% lower. Larceny was 3.4% higher and motor vehicle theft 4.5% higher. The study is from July 2000, so treat it as history.
Takeaway: Do not compare NIBRS-only figures with traditional counts as if they were one series. BJS offers a NIBRS to SRS conversion tool, and the FBI converts detailed NIBRS data to SRS format for its traditional estimates.
In short, FBI figures depend on which agencies reported and how they counted. Check participation and counting rules, do not rank, and compare an agency with itself over time. Next you look at the other federal measure, a survey that does not depend on police reports.
What does the National Crime Victimization Survey measure?
The NCVS measures nonfatal crime that people experienced, whether or not they reported it. BJS says each year it draws on about 240,000 persons in about 150,000 households.
- Who is in it. Persons age 12 or older. The sample includes group quarters such as dormitories. It excludes people on military bases, in institutional settings such as correctional or hospital facilities, and people who are homeless.
- What it leaves out. BJS says the NCVS measures nonfatal victimizations. NIBRS, by contrast, collects fatal and nonfatal crime incidents reported by law enforcement agencies.
- Which year it covers. BJS classifies crimes “by the year of the survey and not by the year of the crime.” The 2024 survey covers crimes from July 1, 2023, to November 30, 2024.
- How precise it is. The 2024 violent victimization rate was 23.3 per 1,000 persons age 12 or older. BJS gives a 95% confidence interval of 20.31 to 26.28 for that estimate.
- A break in 2025. BJS says it fully transitioned to the redesigned instrument (NCVS-R) in January 2025. In its preliminary 2025 release, BJS states: “The NCVS-R estimates are not comparable to legacy NCVS estimates.” Do not set the preliminary 2025 rate of 25.7 per 1,000 against the 2024 legacy rate of 23.3 as a trend. The two BJS reports also show 2024 violent crime excluding simple assault at 8.9 per 1,000 (Two Crime Measures) and 9.9 per 1,000 (the preliminary 2025 release, which draws on the redesigned instrument). Cite the report with each figure.
- Places. The NCVS “was originally designed to provide national-level estimates.” BJS produces direct state estimates for the 22 most populous states, using three years of aggregated data. State identifiers are not on public-use files.
BJS’s criminal victimization report for 2024 holds the legacy-instrument findings. The final 2025 report is forthcoming, per the preliminary release.
Why do FBI and BJS numbers differ?
They are built to answer different questions. BJS’s two-measures report says it plainly: “The NCVS and NIBRS collections have different purposes, use different methods, and measure a set of criminal offenses that are similar but not identical.”
| Measure (2024) | Publisher and basis | Violent crime rate |
|---|---|---|
| FBI national estimate | FBI summary, 2025. Estimated, per 100,000 inhabitants. The FBI updated the 2024 rate. | 362.9 |
| BJS NIBRS-based estimate | BJS Crime Known to Law Enforcement, 2024. Per 100,000 population. | 370.8 |
| BJS NCVS, excluding simple assault | BJS Two Crime Measures report. Nonfatal, reported or not, per 1,000 persons age 12 or older. | 8.9 |
Read the units. The first two are police-reported crime per 100,000 people. The third is survey-reported victimizations per 1,000 people age 12 or older. The FBI’s own summary says its figures “may not be directly comparable to material provided by other organizations.”
The FBI and BJS also use different estimators. The FBI’s traditional estimates combine aggregated SRS data with NIBRS data converted to SRS format. The newer NIBRS-only estimates, which appear in the BJS report and on the CDE, use only NIBRS submissions. The FBI’s summary adds: “Both collections are estimates and should be viewed as analogous measures rather than as one being more accurate than the other.”
In short, the FBI tells you what agencies reported, and the NCVS tells you what people say happened to them. The two should not be averaged or ranked against each other. Next you decide which question your story asks, find the matching table, and check participation and method before you write the number. Compare like with like.
How current is crime data, and where do faster numbers come from?
Federal annual data arrive months after the year ends. The FBI released its 2025 summary in August 2026, using data as of April 2, 2026. BJS published preliminary 2025 victimization estimates in October 2026.
- Year to date. The CDE offers Year-to-Date Master Files for the current calendar year, organized by collection and “updated monthly.”
- BJS NIBRS estimates. BJS published Crime Known to Law Enforcement, 2024 in March 2026. The FBI’s August 2026 report says BJS will publish the 2025 edition in 2026. Check BJS for the current edition.
- City trends. The Council on Criminal Justice, a nonpartisan think tank by its own description, publishes crime trends from “monthly incident-level data obtained from online portals of city police departments.” It warns that these figures “may and often do differ from data subsequently published by the police departments and from other counts released later by the FBI.”
- Dispatch and call logs. For calls for service, see the police scanner guide and the FOIA guide.
Where do you get the raw data?
| Dataset | Publisher | Reporter use |
|---|---|---|
| CDE Documents and Downloads | FBI | CSV tables. Master files are “fixed-length, ASCII text format” and “require some programming knowledge.” |
| Crime Data API | FBI | A read-only web service that returns JSON or CSV for experienced users |
| LEARCAT | BJS | The Law Enforcement Agency Reported Crime Analysis Tool, for NIBRS data at state, county and agency levels. BJS pages give different end years, so check the tool. |
| NIBRS Estimates | FBI, via data.gov | National NIBRS estimates for 109 estimate domains |
| NCVS API | BJS | NCVS data by query. The default is 1,000 records unless you set a limit. |
| N-DASH | BJS | BJS’s online tool for NCVS victimization estimates |
| National Archive of Criminal Justice Data | ICPSR | Public-use NCVS files, per BJS |
The FBI’s A Word About UCR Data, dated May 2021, lists master files available from the CDE, including Return A (offense counts by agency), SHR (Supplementary Homicide Report), Arrest and the NIBRS flat file. Check the CDE for the current list.
Where can you cross-check a number?
Use a source built on different records.
- Deaths. CDC WONDER Underlying Cause of Death draws on death-certificate data, with county, state, injury intent and mechanism options. Its data-use terms say not to present or publish death counts of 9 or fewer. For individual death records, see the obituaries and death records guide.
- Campuses. The Department of Education’s Campus Safety and Security site holds Clery Act data. It lets you compare up to four schools and download the data.
- The agency. Ask the agency or its state UCR program how it counts. Use the Find Experts guide to vet a criminologist before you quote one.
How do you write the number?
Name the publisher, the measure, the place and the period in the same sentence. Say “reported to police” for FBI data and “victimizations” for NCVS data.
A hypothetical sentence: “Example City police reported 90 robberies in 2025, a rate of 150.0 per 100,000 residents, according to the FBI’s Crime Data Explorer, accessed Oct. 30, 2026.” Add a participation note if the agency did not report all 12 months. Keep your notes in a verification log such as the one in the Journalist Toolbox.
Reporting checks
- Name the measure. Say whether the figure is police-reported crime (FBI) or survey-reported victimization (BJS).
- Log the source. Record the publisher, table or report, URL and the date you pulled it.
- Check participation. Confirm the agency submitted 12 months and whether it used SRS or NIBRS.
- Look for breaks. Check for the 2013 rape definition change, the 2021 NIBRS transition and the 2025 NCVS redesign.
- Pick rates or counts. Use rates per 100,000 to compare places of different sizes. Use actual numbers for very small places.
- Do not rank. Compare an agency with itself over time, and name what differs when you compare places.
- Call the agency. Ask the agency or state UCR program to explain any change or gap before you publish.
- Attribute and label. Credit the publisher, label estimates as estimates and state the period.
Next step: Crime, Courts and Law
This page is a research guide, not legal advice.
Sources
- FBI Crime Data Explorer
- FBI CDE Documents and Downloads
- FBI, UCR Summary of Reported Crimes in the Nation, 2025
- FBI, Reported Crimes in the Nation 2024 FAQs
- FBI, UCR Statistics: Their Proper Use
- FBI, Caution Against Ranking (Crime in the United States 2012)
- FBI, SRS to NIBRS: The Path to Better UCR Data
- FBI, A Word About UCR Data
- FBI, State UCR Program Contacts
- BJS, National Crime Victimization Survey program and data collection pages
- BJS, Criminal Victimization, 2024
- BJS, Preliminary Victimization Estimates from the NCVS, 2025
- BJS, The Nation’s Two Crime Measures, 2015-2024
- BJS, Crime Known to Law Enforcement, 2024
- BJS, Subnational Estimates Program
- BJS, Effects of NIBRS on Crime Statistics
- BJS, National Crime Statistics Exchange (NCS-X)
- BJS, NIBRS and data analysis tools pages
- BJS, NCVS API
- BJS, N-DASH
- International Association of Chiefs of Police (IACP), NCS-X NIBRS messaging
- FBI NIBRS Estimates dataset
- National Archive of Criminal Justice Data
- CDC WONDER
- U.S. Department of Education, Campus Safety and Security
- Council on Criminal Justice
Sources
- “long-standing policy against ranking participating law enforcement agencies on the basis of crime data alone.”ucr.fbi.gov
- “provides a nationwide view of crime based on data submissions from law enforcement agencies throughout the country.”cde.ucr.cjis.gov
- National Crime Victimization Surveybjs.ojp.gov
- IACPtheiacp.org
- state UCR program contact listle.fbi.gov
- Council on Criminal Justicecounciloncj.org
- NIBRS Estimatescatalog.data.gov
- N-DASHncvs.bjs.ojp.gov